How to Read a Storm
In this workshop, hosted by Bergen Centre for Electronic Arts and led by Soph, we explored how to ‘read’ cyclones in the sky and satellite images.
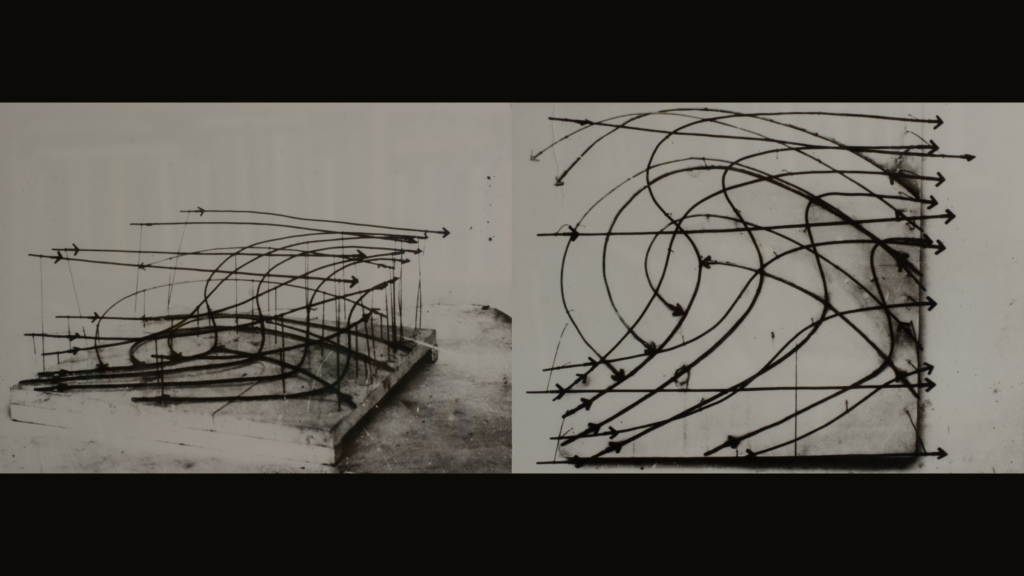
Informed by Bergen’s wet location at the end of the Jet Stream and its special place in meteorology as home of the so-called Norwegian cyclone model, we spent the day assembling different knowledges of storm systems.
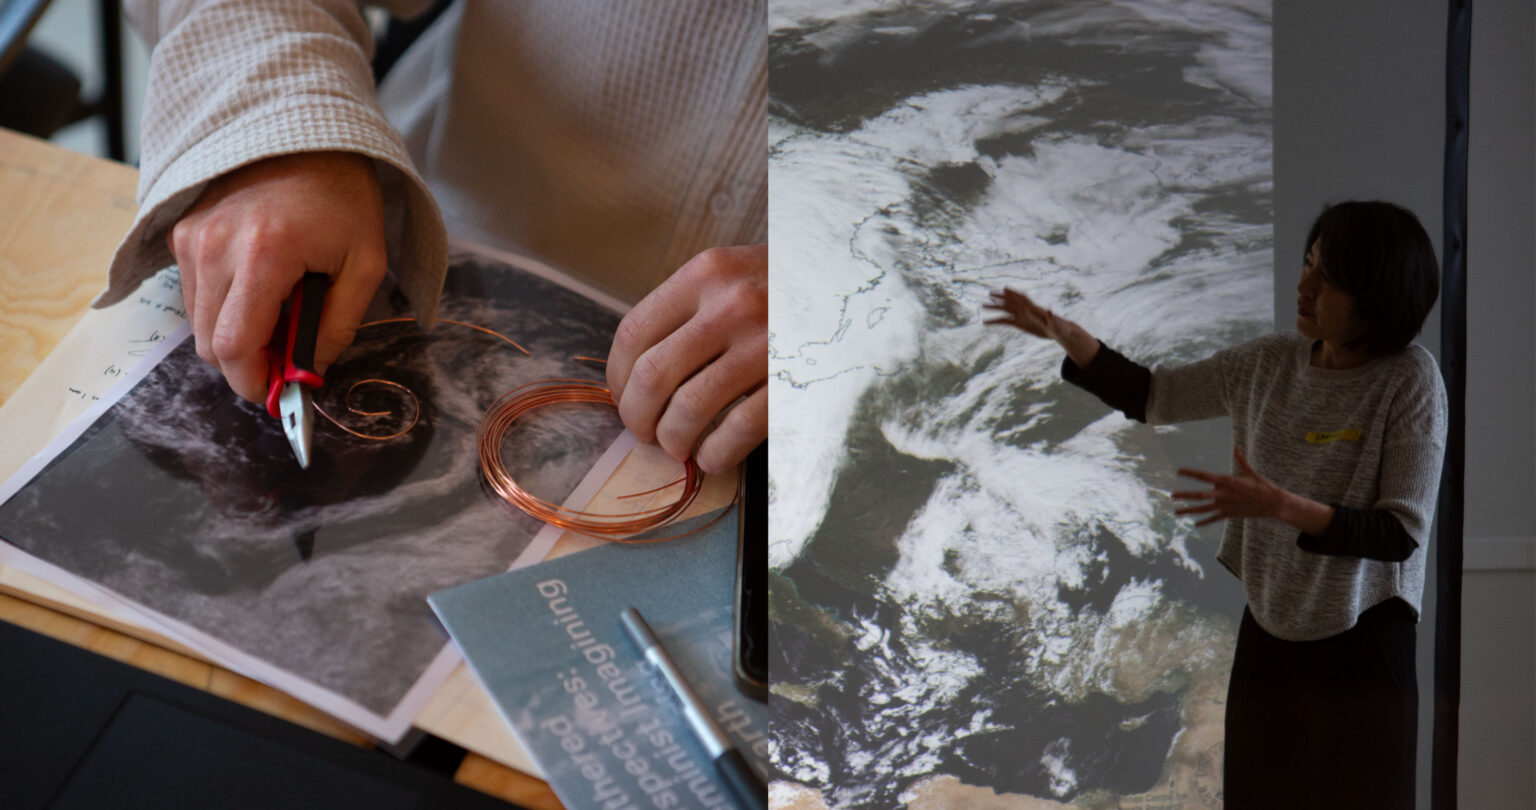
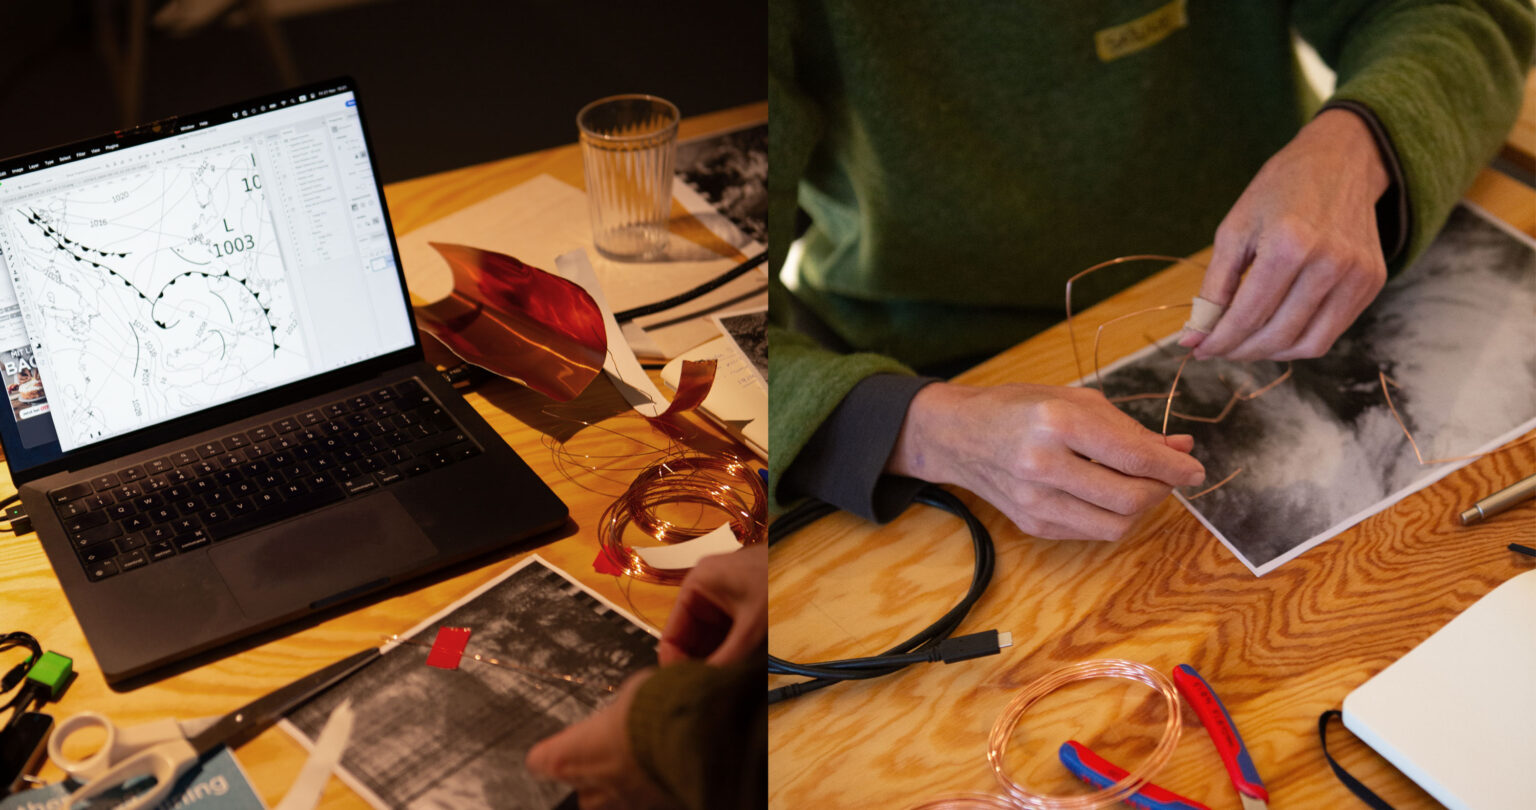
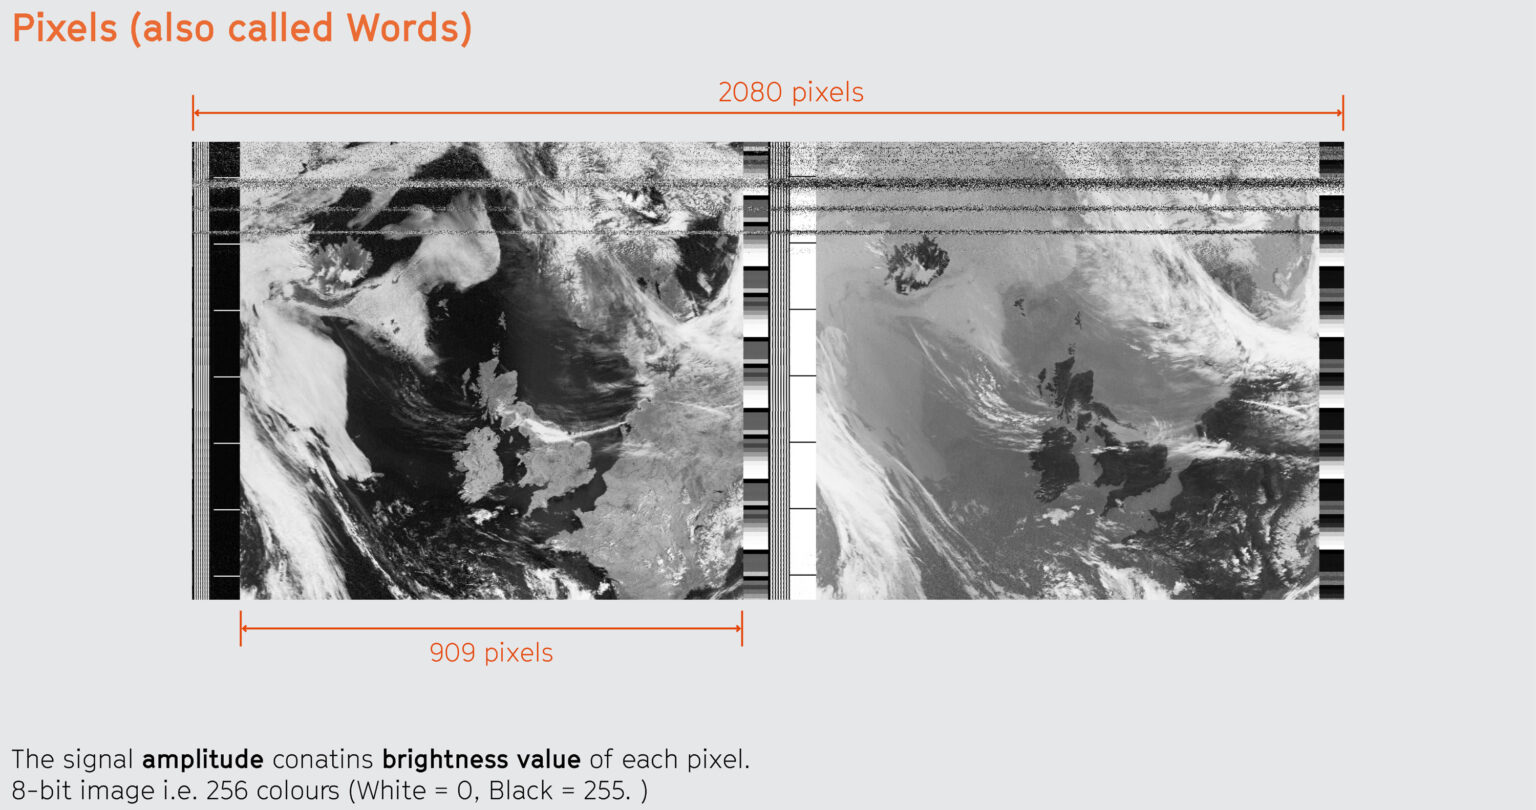
Soph introduced open-weather’s unique Public Archive of more than 2,500 satellite images and shared the basics of DIY satellite imagery reception. In the afternoon, guided by the generous expertise of climate scientist Camille Li from the Bjerknes Centre for Climate Research, meteorologist Ellen Viste, and our own experiences of weather, we attempted to model cyclones.
The workshop was framed by the larger, speculative question of how our different relationships to weather are and must change with the climate. It was free and open to all. No prior knowledge was required to participate.
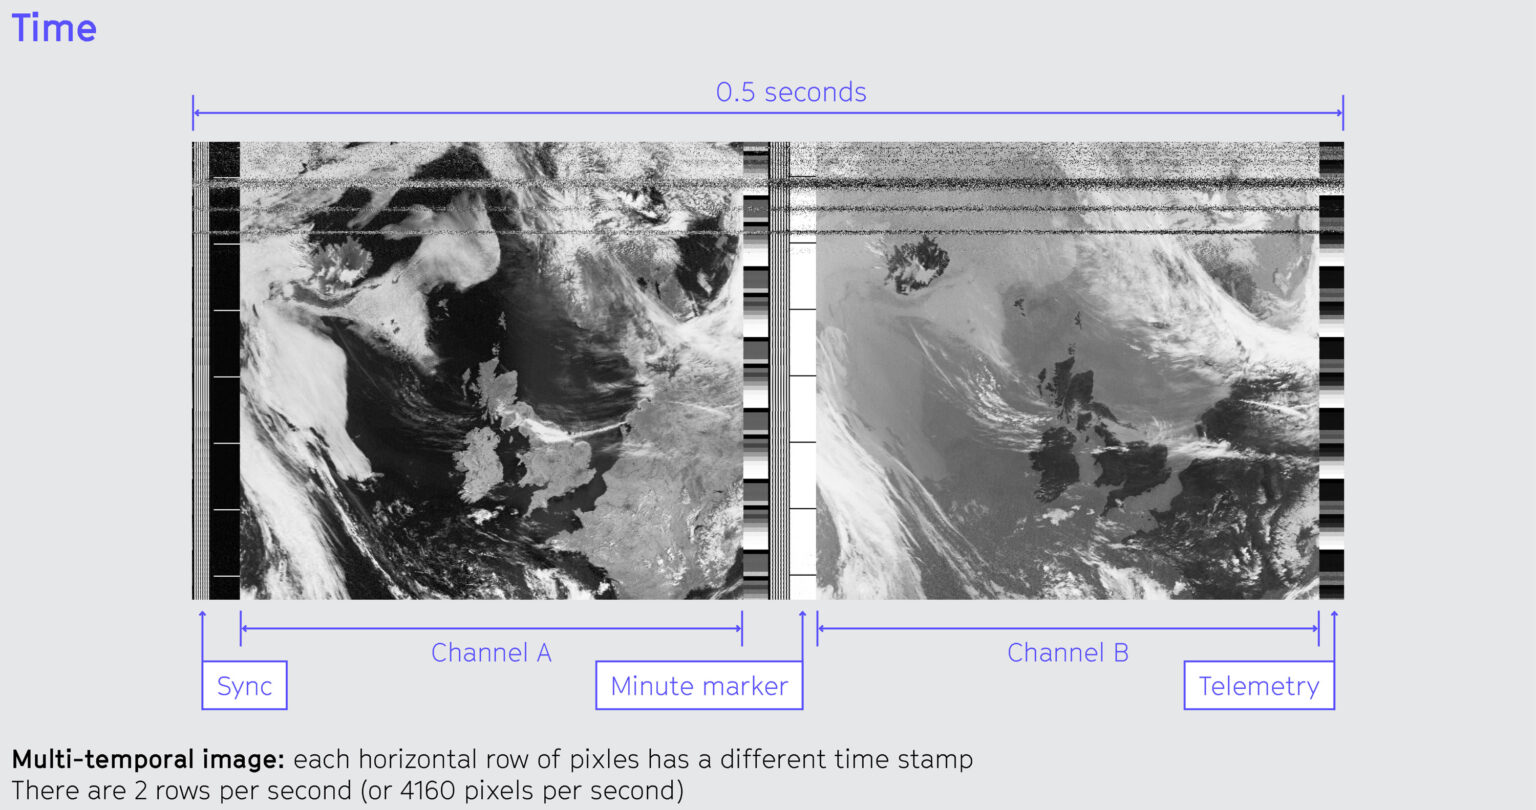
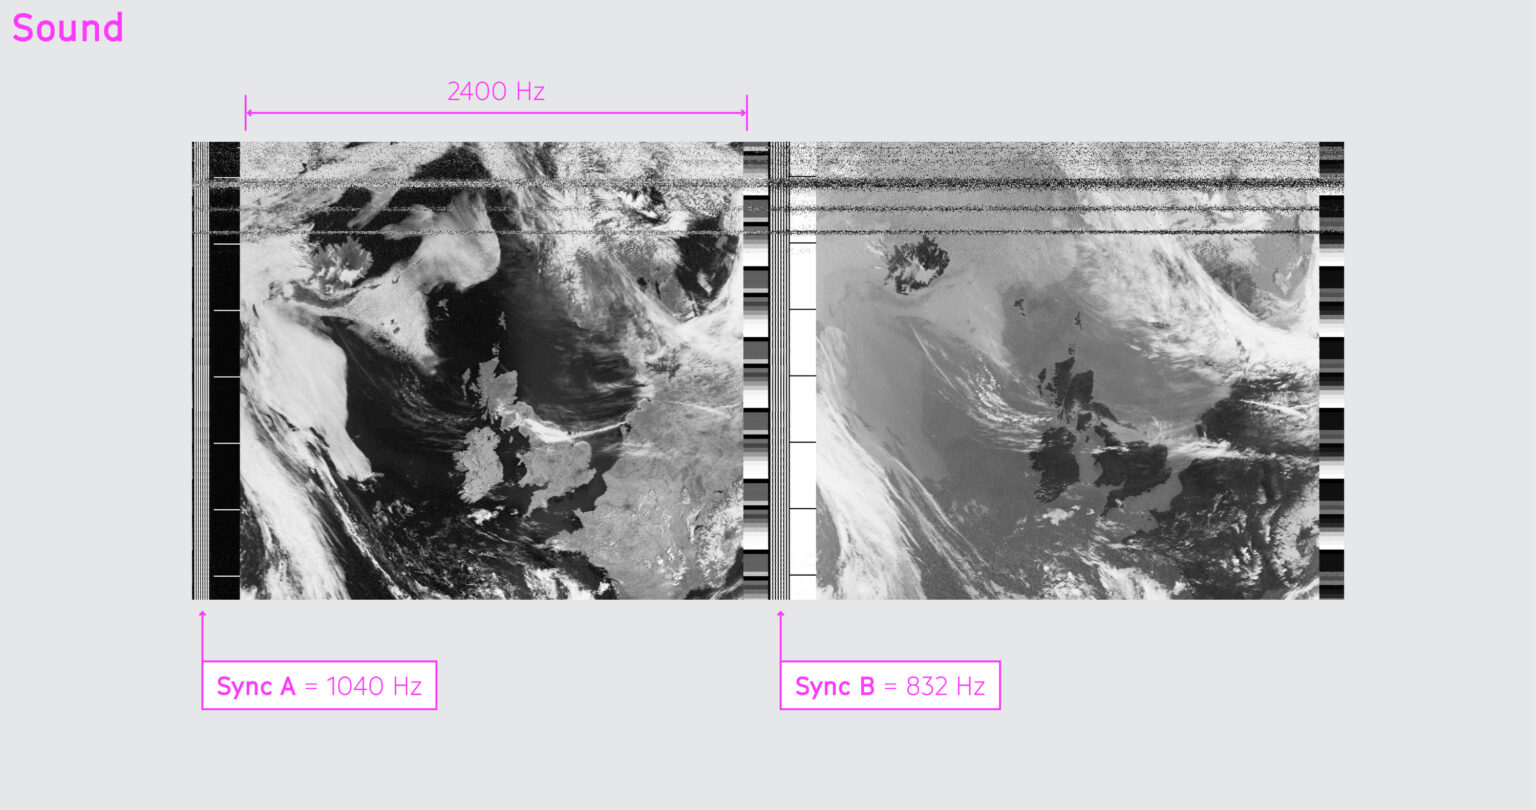
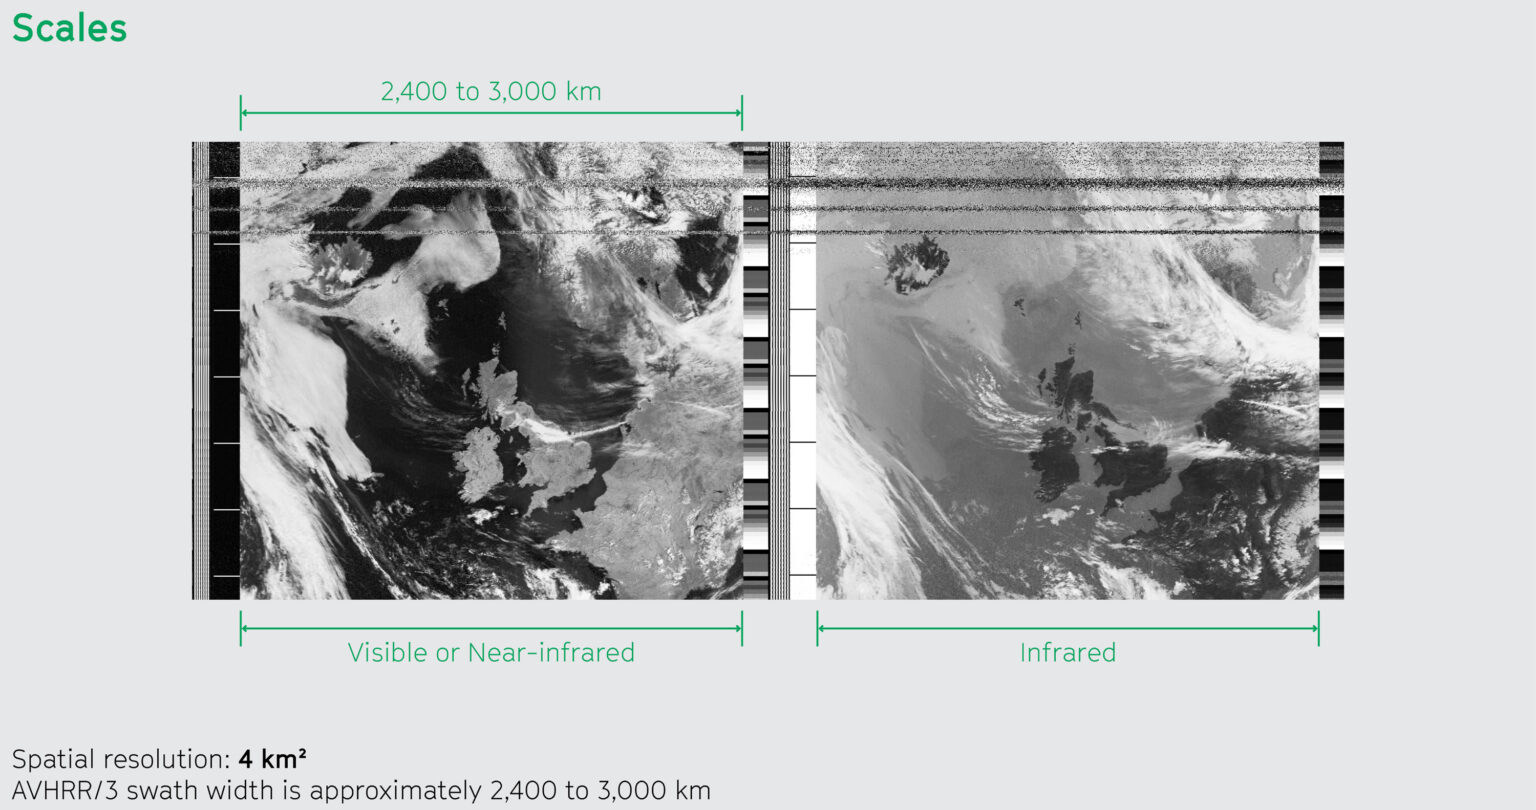
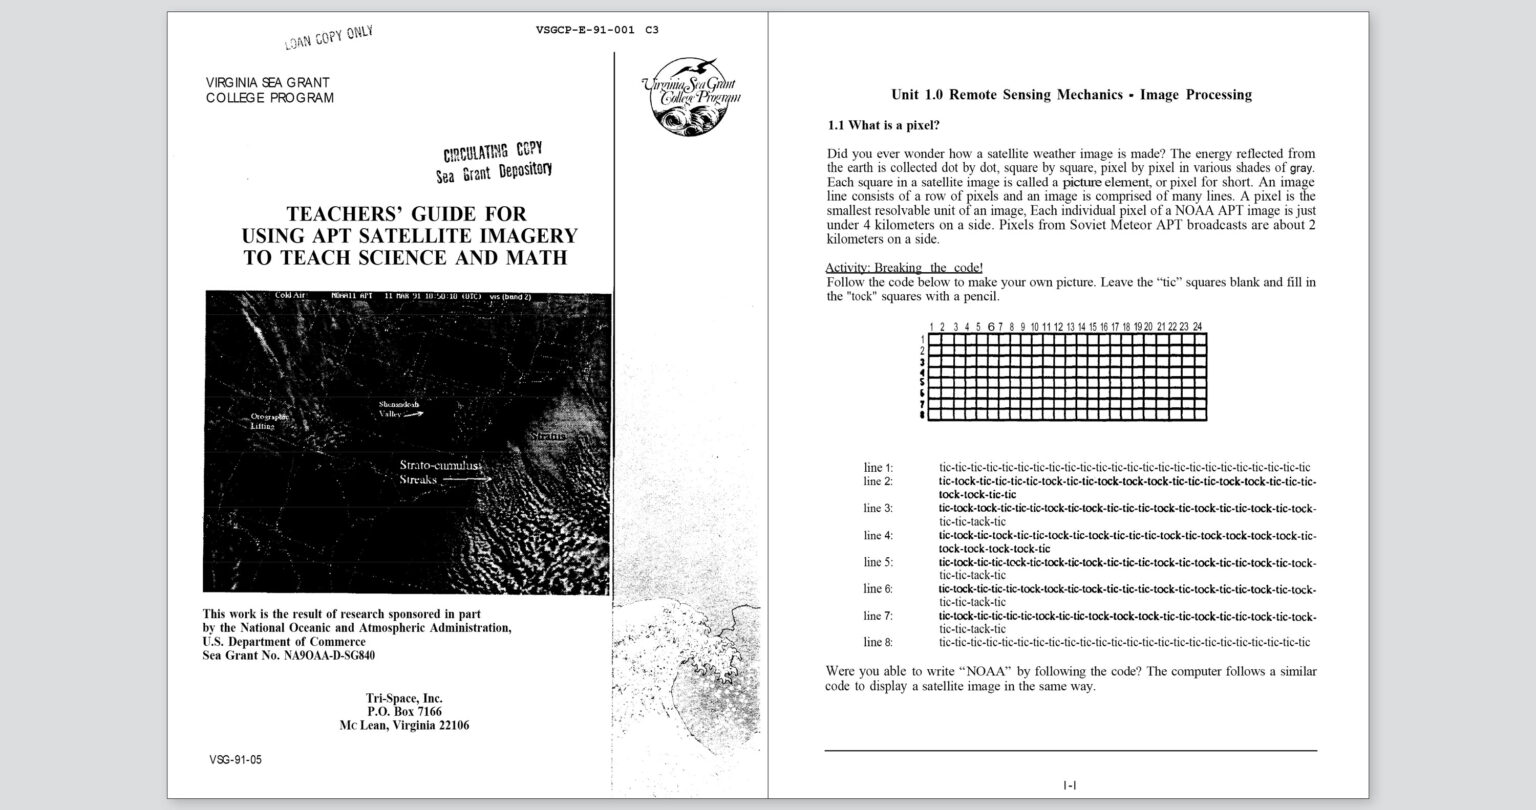
The images below are a sample of the educational resources produced for the workshop.
Credits
Workshop by Soph Dyer
Developed and led in close collaboration with scientists Camille Li (Bjerknes Centre for Climate Research and University of Bergen) and Ellen Viste (independent)
Commissioned by Bergen Centre for Electronic Arts on the occasion of ‘The Only Lasting Truth is Change 2025’ symposia
Special thanks to Ellen Viste for photographing the surviving images of the wire model