Demodulation
Demodulation is the process of extracting the original information-bearing signal from a carrier wave. For APT transmissions, demodulation means extracting the image values from the 2400 Hz Amplitude Modulated (AM) wave.
The figure below illustrates this. Amplitude modulating the carrier signal (red wave) with the message signal (green wave) produces the AM signal (purple).
In the figure, the waves called AM signal demod ABS, AM signal demod Hilbert and AM signal demod cos are the results of demodulating the AM signal with the Absolute Value, Hilbert FFT and Cosine methods, respectively. 🦜 Which method do you think is the most precise?
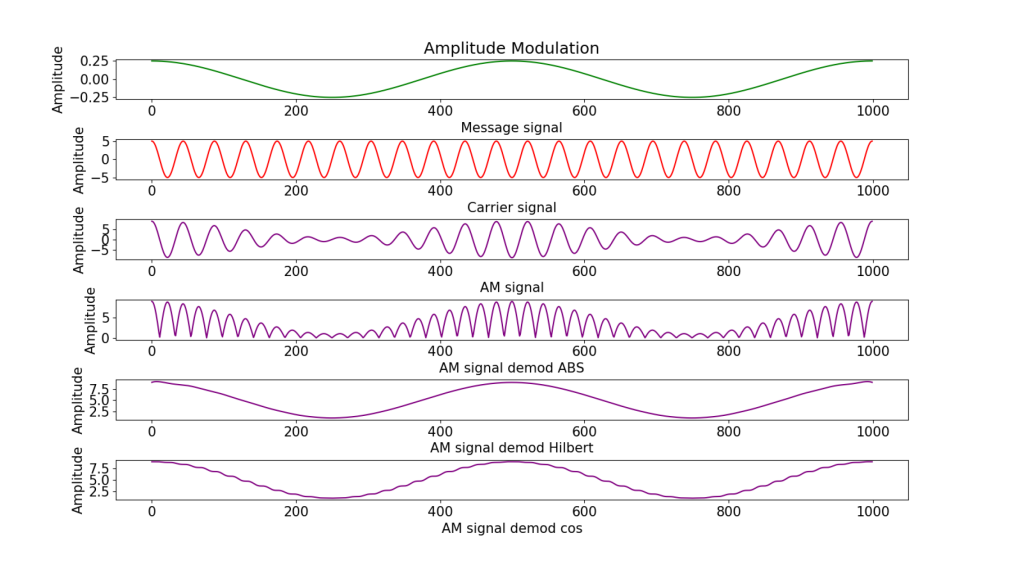
Comparing AM demodulation methods. Source: Bill Liles
Cosine
The ‘Cosine method’ is one way to demodulate an APT transmission into an image.
The method uses the following equation:
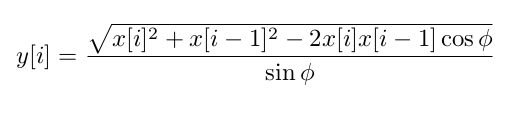
The equation for demodulating a signal using the Law of Cosines. Source: Martin Bernardi
To generate each output sample y[i], we use the current input sample x[i], the previous input sample x[i – 1] and the carrier frequency. Theta Ø is 2π times the carrier frequency in Hz divided by the sample rate in samples/sec. Note: sine and cosine functions are computed in radians.
A mathematical guide to the Cosine method is available on Martin Bernardi’s GitHub.
Absolute Value
The ‘Absolute Value’ method is another way to demodulate an APT transmission into an image.
A 2400 Hz amplitude modulated wave has negative and positive values. Taking the absolute value of all the points in the wave returns only positive values in a time series.
After some filtering, the positive values in this time series are the image values.
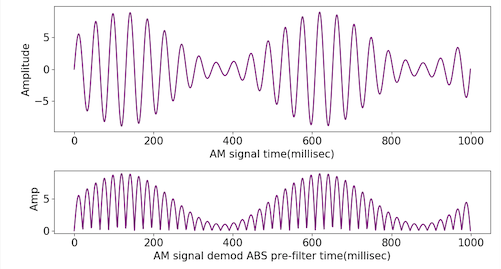
Above: A 2400Hz amplitude modulated wave. Below: the absolute value of the wave. Source: Bill Liles.
Hilbert FFT
The ‘Hilbert FFT’ method is a third way to demodulate an APT transmission into an image.
A 2400Hz amplitude modulated wave can be described as a time series of samples.
First, we turn that time series into I/Q signals.
Second, we take the Fast Fourier Transform (FFT) of the input time series, set all the negative frequencies of the transform to zero, and then take the inverse Fourier Transform.
Third, we compute the ‘envelope signal’, or the demodulated signal. Given an I/Q time series, the AM demodulation is the absolute value of each pair of points defined as: abs(I_i, Q_i) = sqrt( I_i * I_i + Q_i * Q_i) where I_i and Q_i are the ith samples of the I/Q time series.
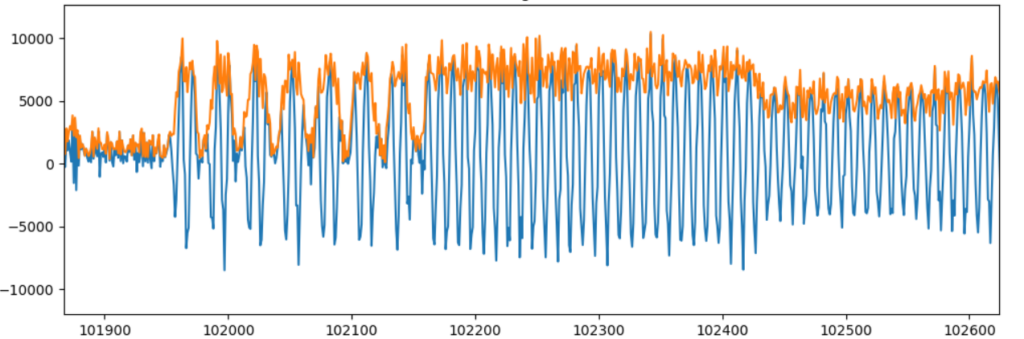
Visualisation of an APT signal. The orange line is the ‘envelope signal’ computed with the Hilbert FFT method. Source: Bill Liles
APT Channels
The APT image format includes:
- two image channels: channel A and channel B
- two sync signals: sync A and sync B
- telemetry data: telemetry frame A and telemetry frame B
- space data and minute markers
One line of information in the APT format (including sync signals, telemetry, space data and channel A/B images) takes 0.5 seconds. This means two full lines of data are transmitted per second.
Image channels A and B are produced by different sensors on the Advanced Very High Resolution Radiometer. See this post for more on the sensors.
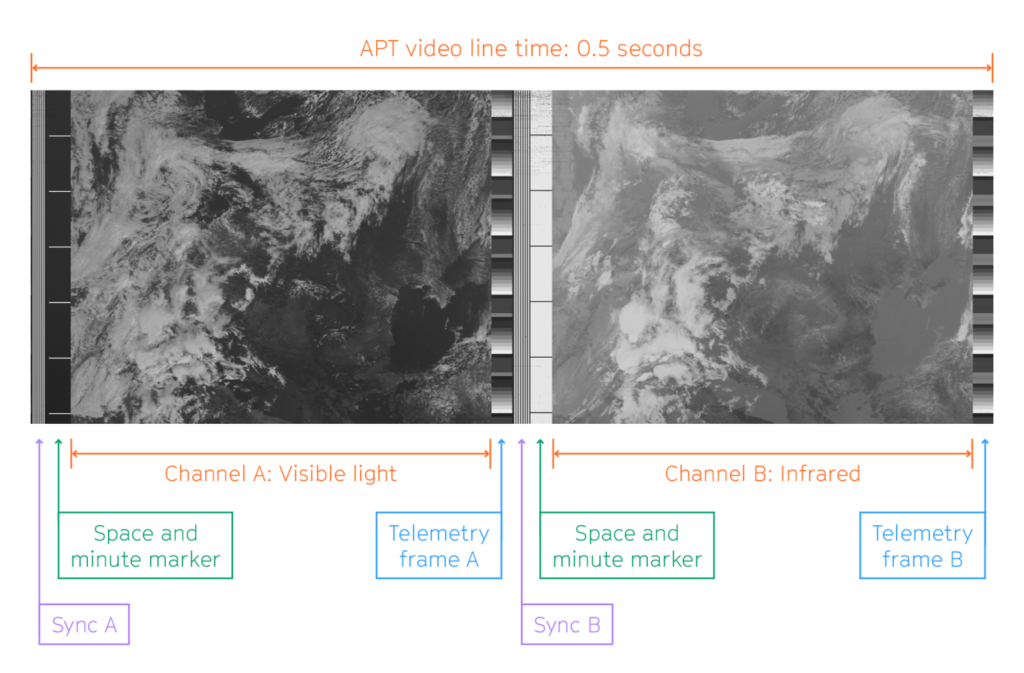
A diagram of the APT Frame Format adapted from “User’s Guide for Building and Operating Environmental Satellite Receiving Stations” published by NOAA in 2009.
Sync
In APT transmissions, two ‘sync’ codes mark the start and midpoint of each line of image values: sync A and sync B.
They are clearly identifiable by your ears as a rhythmic ‘tick tock’.
It is possible to identify sync A in the APT signal below. After 34600 samples on the x axis, note the seven distinct ‘spikes’. These spikes are the Sync A signal. This signifies the start of a new line in the APT image.
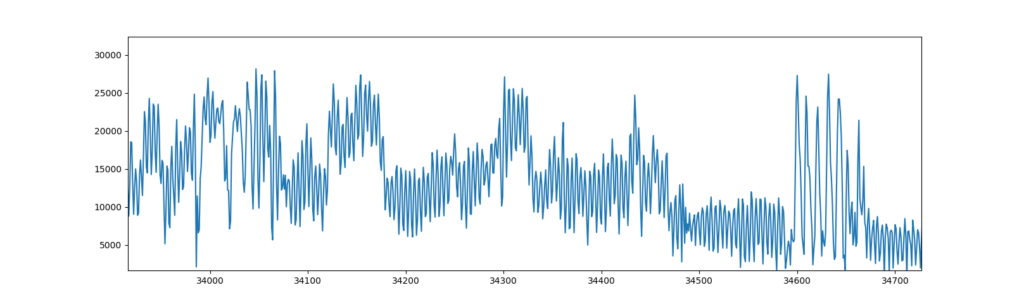
Figure 2: Visualisation of a demodulated APT signal. Source: Bill Liles
Open-weather apt searches the APT transmission for all sync A locations. It does so by using a sample sync A frame and matching the signal to the frame. After each sync A position found, open-weather apt demodulates and processes the image values on that line.
Equalise
Raw NOAA satellite images often appear grey, low contrast.
Histogram equalisation can be applied to increase the global contrast of the image and so reveal details, such as cloud features or the difference between coastline and water.
Histogram equalisation effectively spreads out the most frequent pixel brightness values (coloured red in the Figure 7). In other words, it stretches out the intensity range of the image.
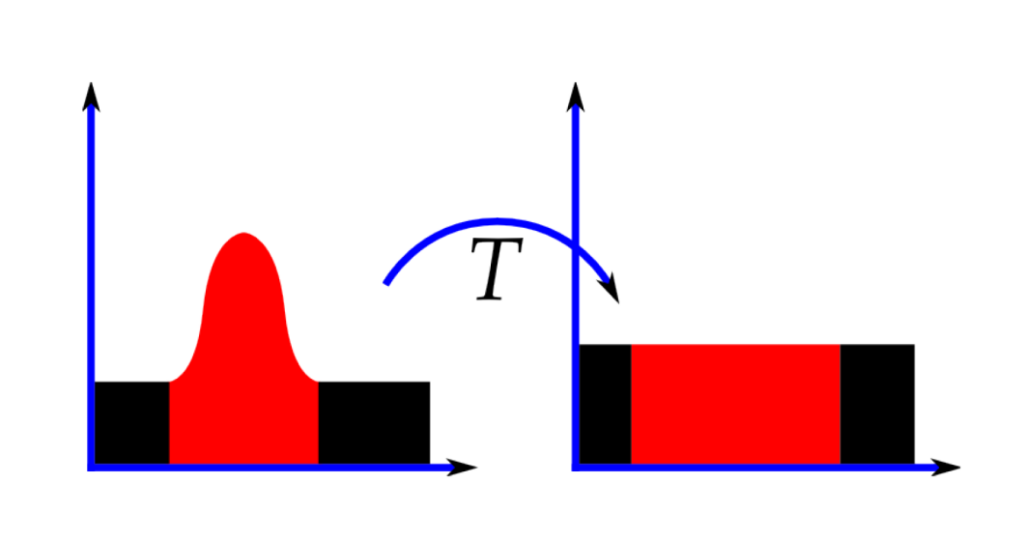
Figure 7: Before and after the histogram equalisation transform (T). Source: Wikipedia, public domain
Select WAV
You can upload WAV files of any sample rate.
No need to resample to 11025 Hz.

decoding